Creates a clean visualization of one or more effect size estimates with their confidence intervals.
Usage
plot_ci(
  ci = NULL,
  estimate = NULL,
  lower = NULL,
  upper = NULL,
  names = NULL,
  n = NULL,
  conf_level = 0.95,
  show_n = TRUE,
  reference_line = NULL,
  xlab = "Effect Size",
  title = NULL,
  palette = "okabe_ito"
)
Arguments
- ci
A
data.framefrom a DMARci_*function. When supplied, the function auto-detects the format and extracts the point estimate(s), lower limit(s), and upper limit(s). Explicitestimate,lower, andupperarguments override values parsed fromci.- estimate
Numeric vector of point estimates.
- lower
Numeric vector of lower confidence limits.
- upper
Numeric vector of upper confidence limits.
- names
Optional character vector of labels for each effect.
- n
Optional numeric vector (or scalar) of sample sizes. Recycled to match the number of effects.
- conf_level
Confidence level; used only for the axis label (default
0.95).- show_n
Logical. If
TRUE(the default), the sample size is annotated above each estimate, with the estimate and its interval printed below.- reference_line
Optional numeric value at which to draw a vertical reference line (e.g.,
0for mean differences,1for ratios).- xlab
Label for the horizontal (effect size) axis. Defaults to
"Effect Size".- title
Optional plot title.
- palette
Character string naming the color palette. The point estimates and interval bars are drawn in the palette's primary color. Defaults to
"okabe_ito", base R's colorblind-safe Okabe-Ito palette;"tableau"is also available.
Details
The function accepts either (a) a data.frame produced by an
DMAR ci_* function (e.g., ci_smd, ci_R2,
ci_omega_squared), or (b) explicit numeric vectors for the
estimate(s), lower bound(s), and upper bound(s).
The function recognizes three DMAR output formats:
- Long term/value with estimate row
Output from
ci_smd, which includes a row for the point estimate (e.g.,term = "smd") in addition to"lower_limit"and"upper_limit".- Long term/value without estimate
Output from
ci_Rorci_R2, which contains only"lower_limit"and"upper_limit". Supply the point estimate via theestimateargument.- Wide per-effect format
Output from
ci_omega_squared, which has one row per effect with columns for the point estimate,lower_limit,upper_limit, andN.
See also
ci_smd, ci_R, ci_R2,
ci_omega_squared, plot_smd,
plot_R2
Other plotting:
plot_R2(),
plot_cfa_k(),
plot_equivalence(),
plot_forest(),
plot_irt_information(),
plot_mediation_mbco(),
plot_randomization_test(),
plot_regions_of_significance(),
plot_smd(),
plot_trajectories(),
plot_trajectories_fitted(),
power_equivalence_md_plot()
Author
Ken Kelley kkelley@nd.edu
Examples
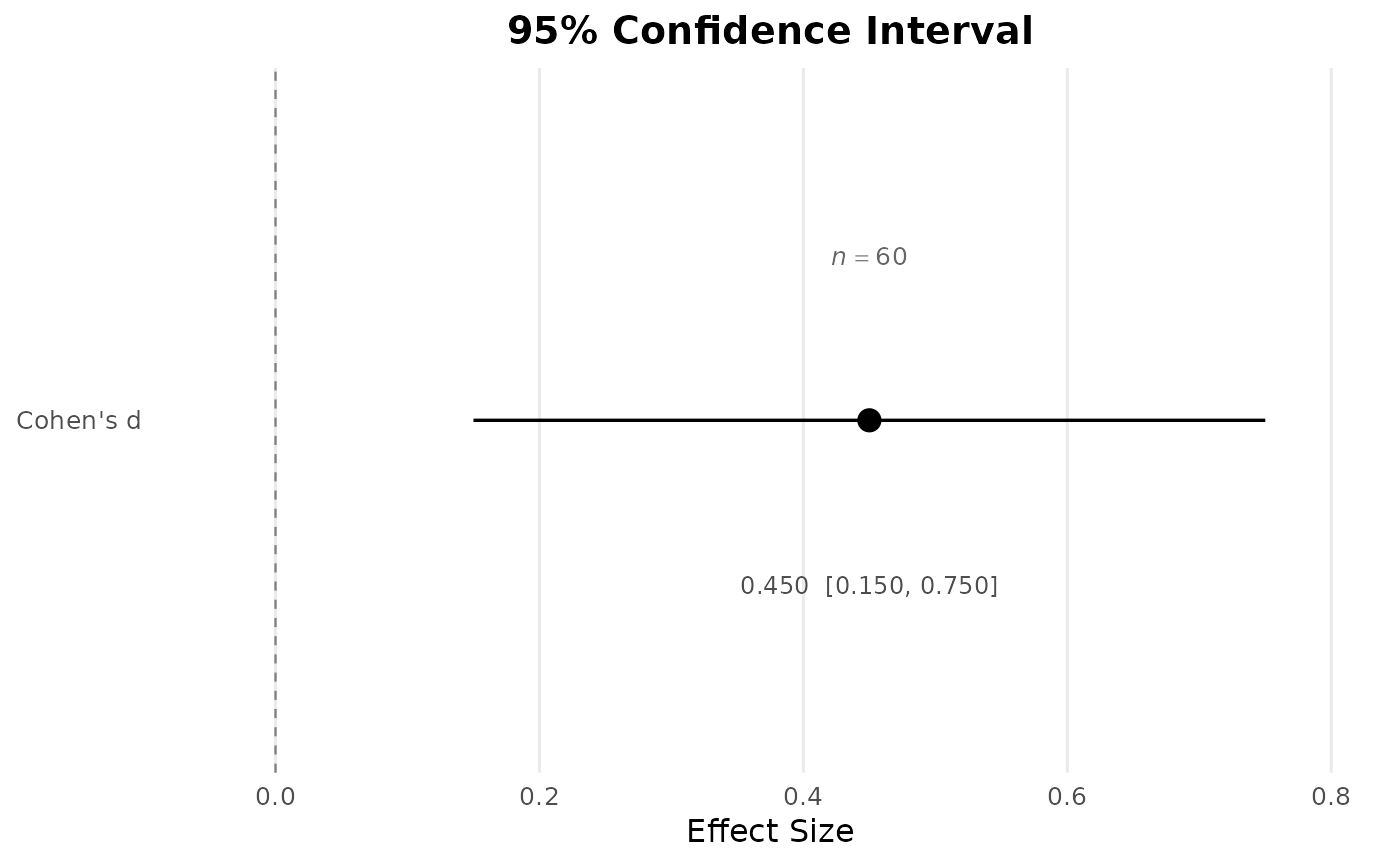
# From explicit values.
plot_ci(estimate = 0.45, lower = 0.15, upper = 0.75,
names = "Cohen's d", n = 60, reference_line = 0)
 # From ci_smd() output.
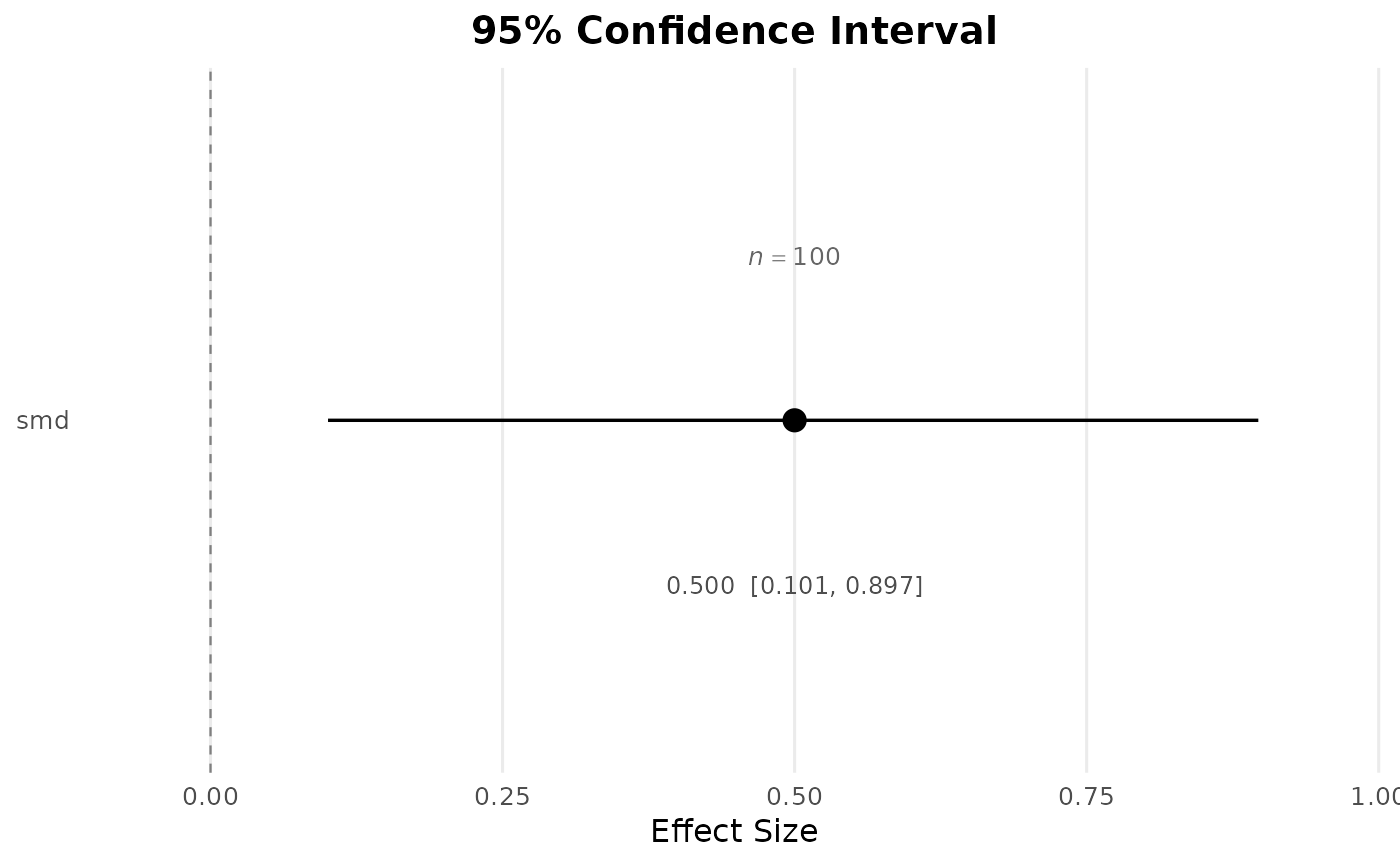
ci_result <- ci_smd(smd = 0.5, n_1 = 50, n_2 = 50)
plot_ci(ci_result, n = 100, reference_line = 0)
# From ci_smd() output.
ci_result <- ci_smd(smd = 0.5, n_1 = 50, n_2 = 50)
plot_ci(ci_result, n = 100, reference_line = 0)
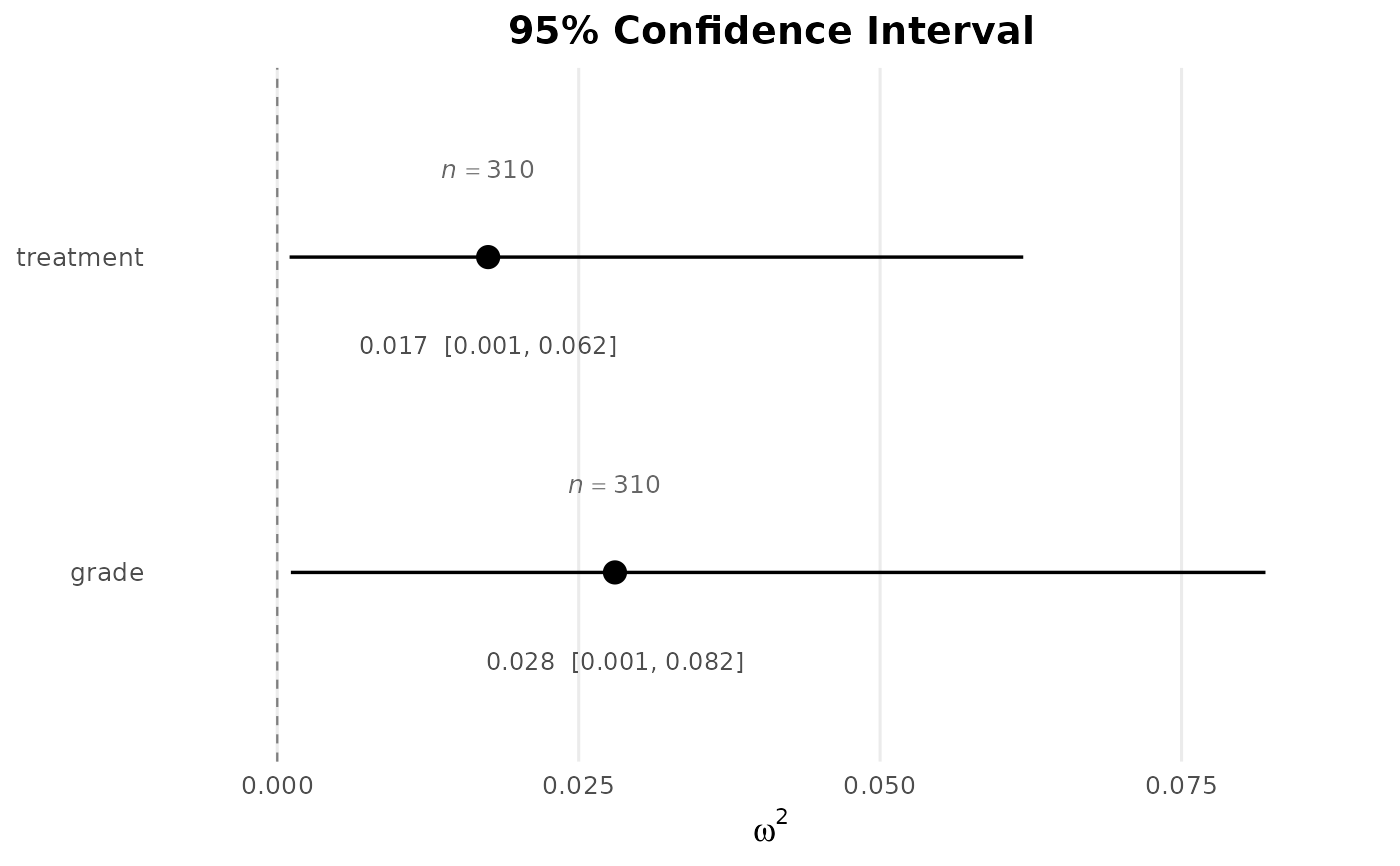
 # Multiple effects from ci_omega_squared(): the expectancy treatment
# and the grade classification in the pygmalion data.
pyg <- pygmalion
pyg$grade <- factor(pyg$grade)
fit <- aov(iq_8 ~ treatment + grade, data = pyg)
omega_result <- ci_omega_squared(fit)
plot_ci(omega_result, reference_line = 0,
xlab = expression(omega^2))
# Multiple effects from ci_omega_squared(): the expectancy treatment
# and the grade classification in the pygmalion data.
pyg <- pygmalion
pyg$grade <- factor(pyg$grade)
fit <- aov(iq_8 ~ treatment + grade, data = pyg)
omega_result <- ci_omega_squared(fit)
plot_ci(omega_result, reference_line = 0,
xlab = expression(omega^2))