A base-graphics plot for the two kinds of table POEMED returns. For a
power curve from pe_power_curve() it draws the empirical rejection
rate of the benchmark and power-enhanced tests against the
signal-strength grid, with the nominal level marked. For a single
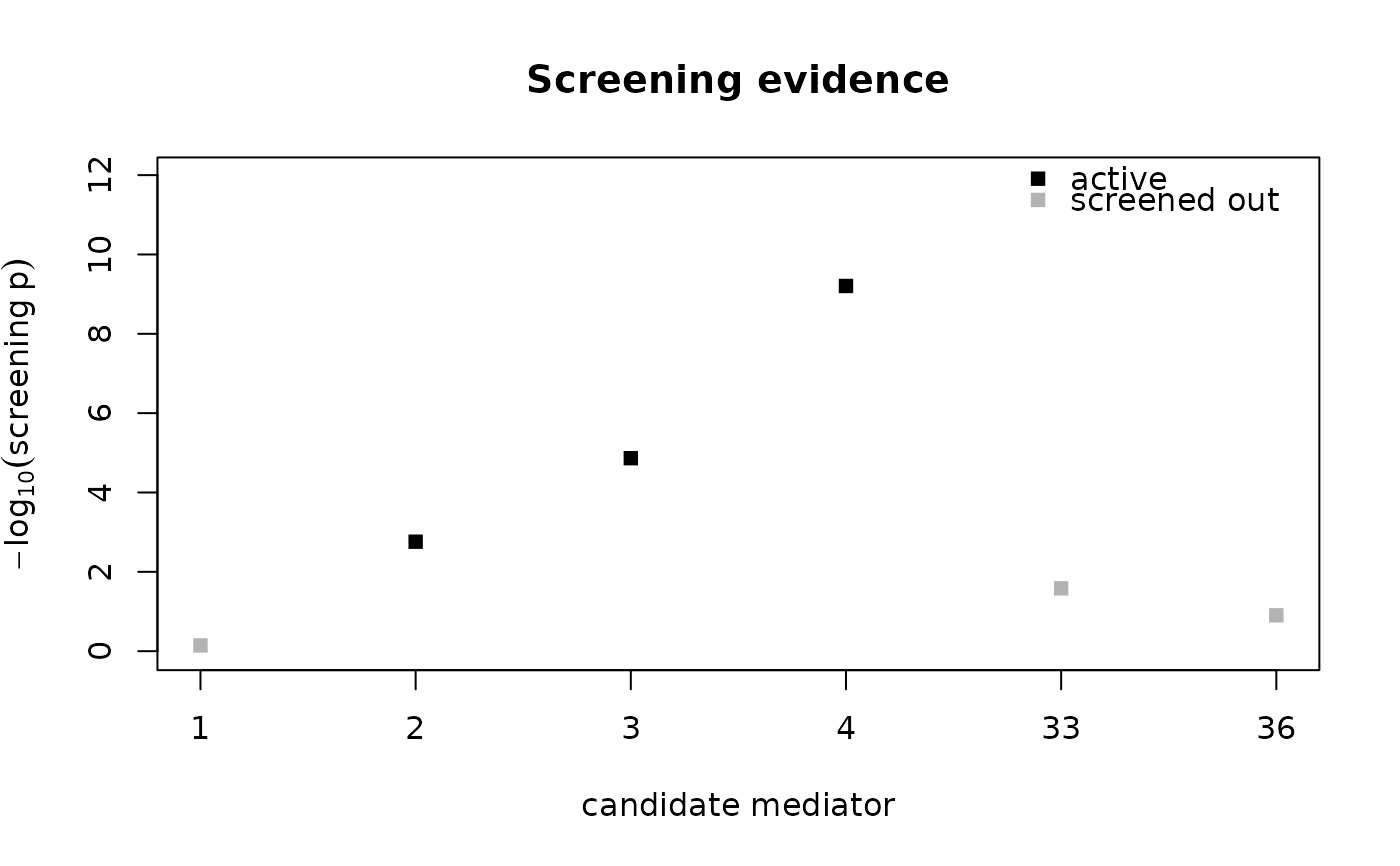
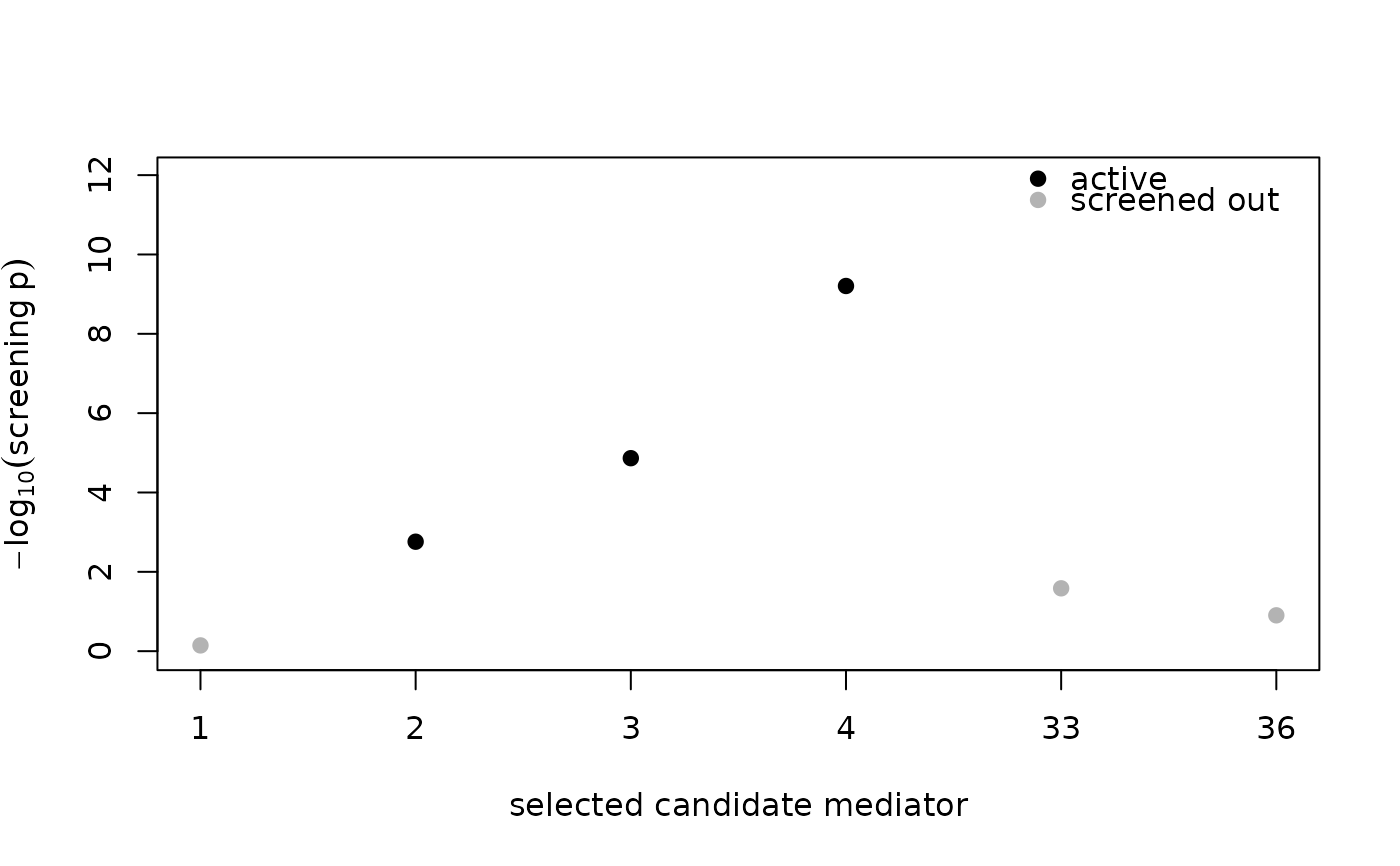
pe_mediation() fit it draws the per-mediator screening evidence
(\(-\log_{10}\) of the screening p-value) for each candidate
mediator the penalized fit selected, with the ones the screen identified as
active highlighted (black by default, “active” in the legend; the
other candidates are gray, “screened out”), so it is clear which
mediators drove the result.
Usage
# S3 method for class 'poemed_tbl'
plot(x, ...)
Arguments
- x
A
poemed_tblfrompe_power_curve()orpe_mediation().- ...
Further graphical parameters passed to the underlying
plot.default()call. They override the defaults, which arexlab,ylab,pch,col, andylim(from 0 to 1.3 times the tallest point, leaving room for the legend) in the per-mediator view andxlab,ylab,pch,type, andylimin the power-curve view, soplot(fit, xlab = "mediator", col = "red")works. A suppliedpch,col, orltyis carried into the legend. In the per-mediator view the x axis is labeled with the mediators' names or positions; passingxaxtreplaces that axis with the onexaxtasks for.
Value
x, invisibly. Called for the plot it draws. A table that is
neither a fit with a per-mediator table nor a power curve draws
nothing and gives a message.
Details
A screening p-value is stored as exactly 0 only when it underflows the
smallest double, which takes both path statistics at about 38 or more
in absolute value (the table prints it as < 0.0001, like any p-value
below that floor). Its
\(-\log_{10}\) is infinite, so the per-mediator view draws such a
point at a cap instead. The cap is the larger of \(-\log_{10}\) of
the machine epsilon (about 15.65) and the tallest finite point. A capped
point is drawn as a triangle, a dotted line marks the cap, and the
legend says so. The true height of a capped point is at least the cap.
Only the drawing changes; the stored screen_p values (see
pe_mediators()) are untouched.
Examples
set.seed(113)
d <- simulate_mediation_data(n = 200, p = 60, outcome = "continuous",
pattern = "contrasting", c1 = 1)
fit <- pe_mediation(d$X, d$Y, d$M, outcome = "continuous")
#> Warning: HBIC selected lambda = 0.05, the smallest value of `lambda_grid`, for the full model and the reduced model of the benchmark test. The criterion is minimized over the grid alone, so its minimum may lie beyond that end or between the end and its neighbor. Consider extending the grid past it and using a finer partition (more values), and compare the active mediators identified and the p-values across grids.
# HBIC chose the smallest value of the default grid here, so the fit
# warned; see the lambda_grid argument of ?pe_mediation.
plot(fit)
 plot(fit, main = "Screening evidence", xlab = "candidate mediator", pch = 15)